
Login with email
Login
Login with your email or your MT4 credentials.
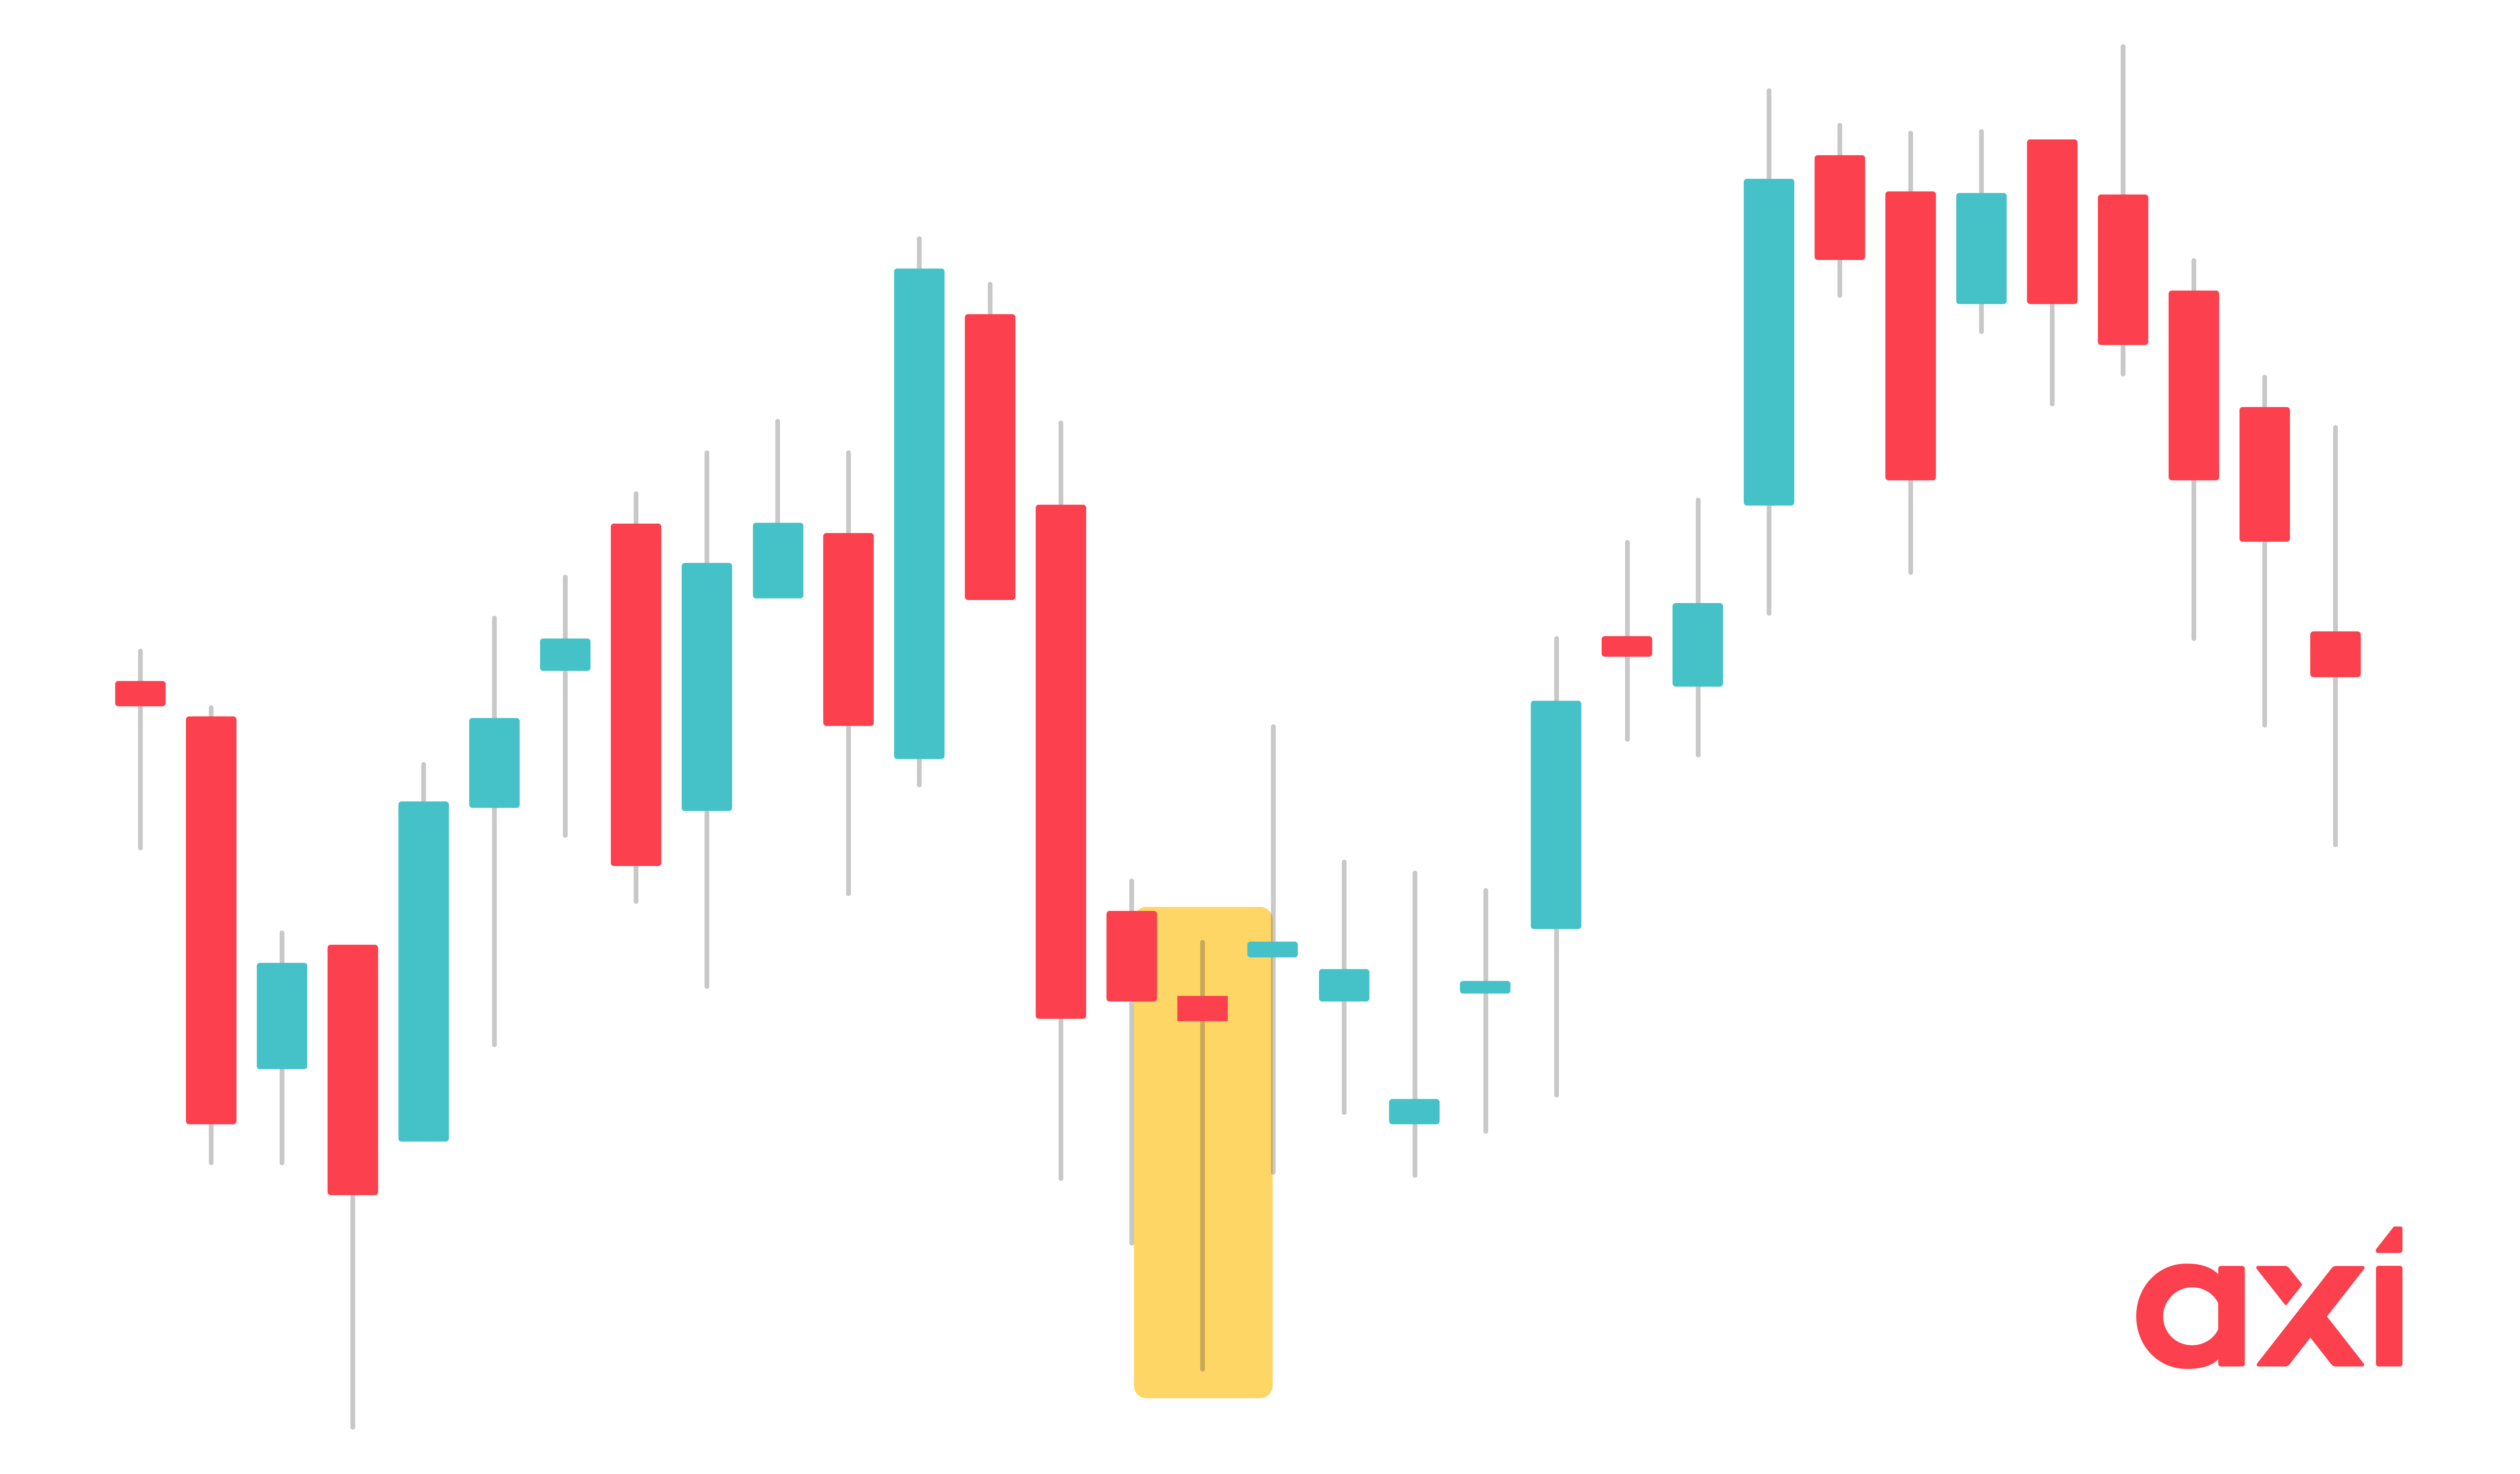
A dragonfly doji is a candlestick pattern that signals a potential trend reversal. It generally appears during a downtrend and indicates a bullish reversal. A dragonfly doji is easy to spot due to its unique structure. As with any candlestick, it is important to wait for the confirmation signal before entering a trade.
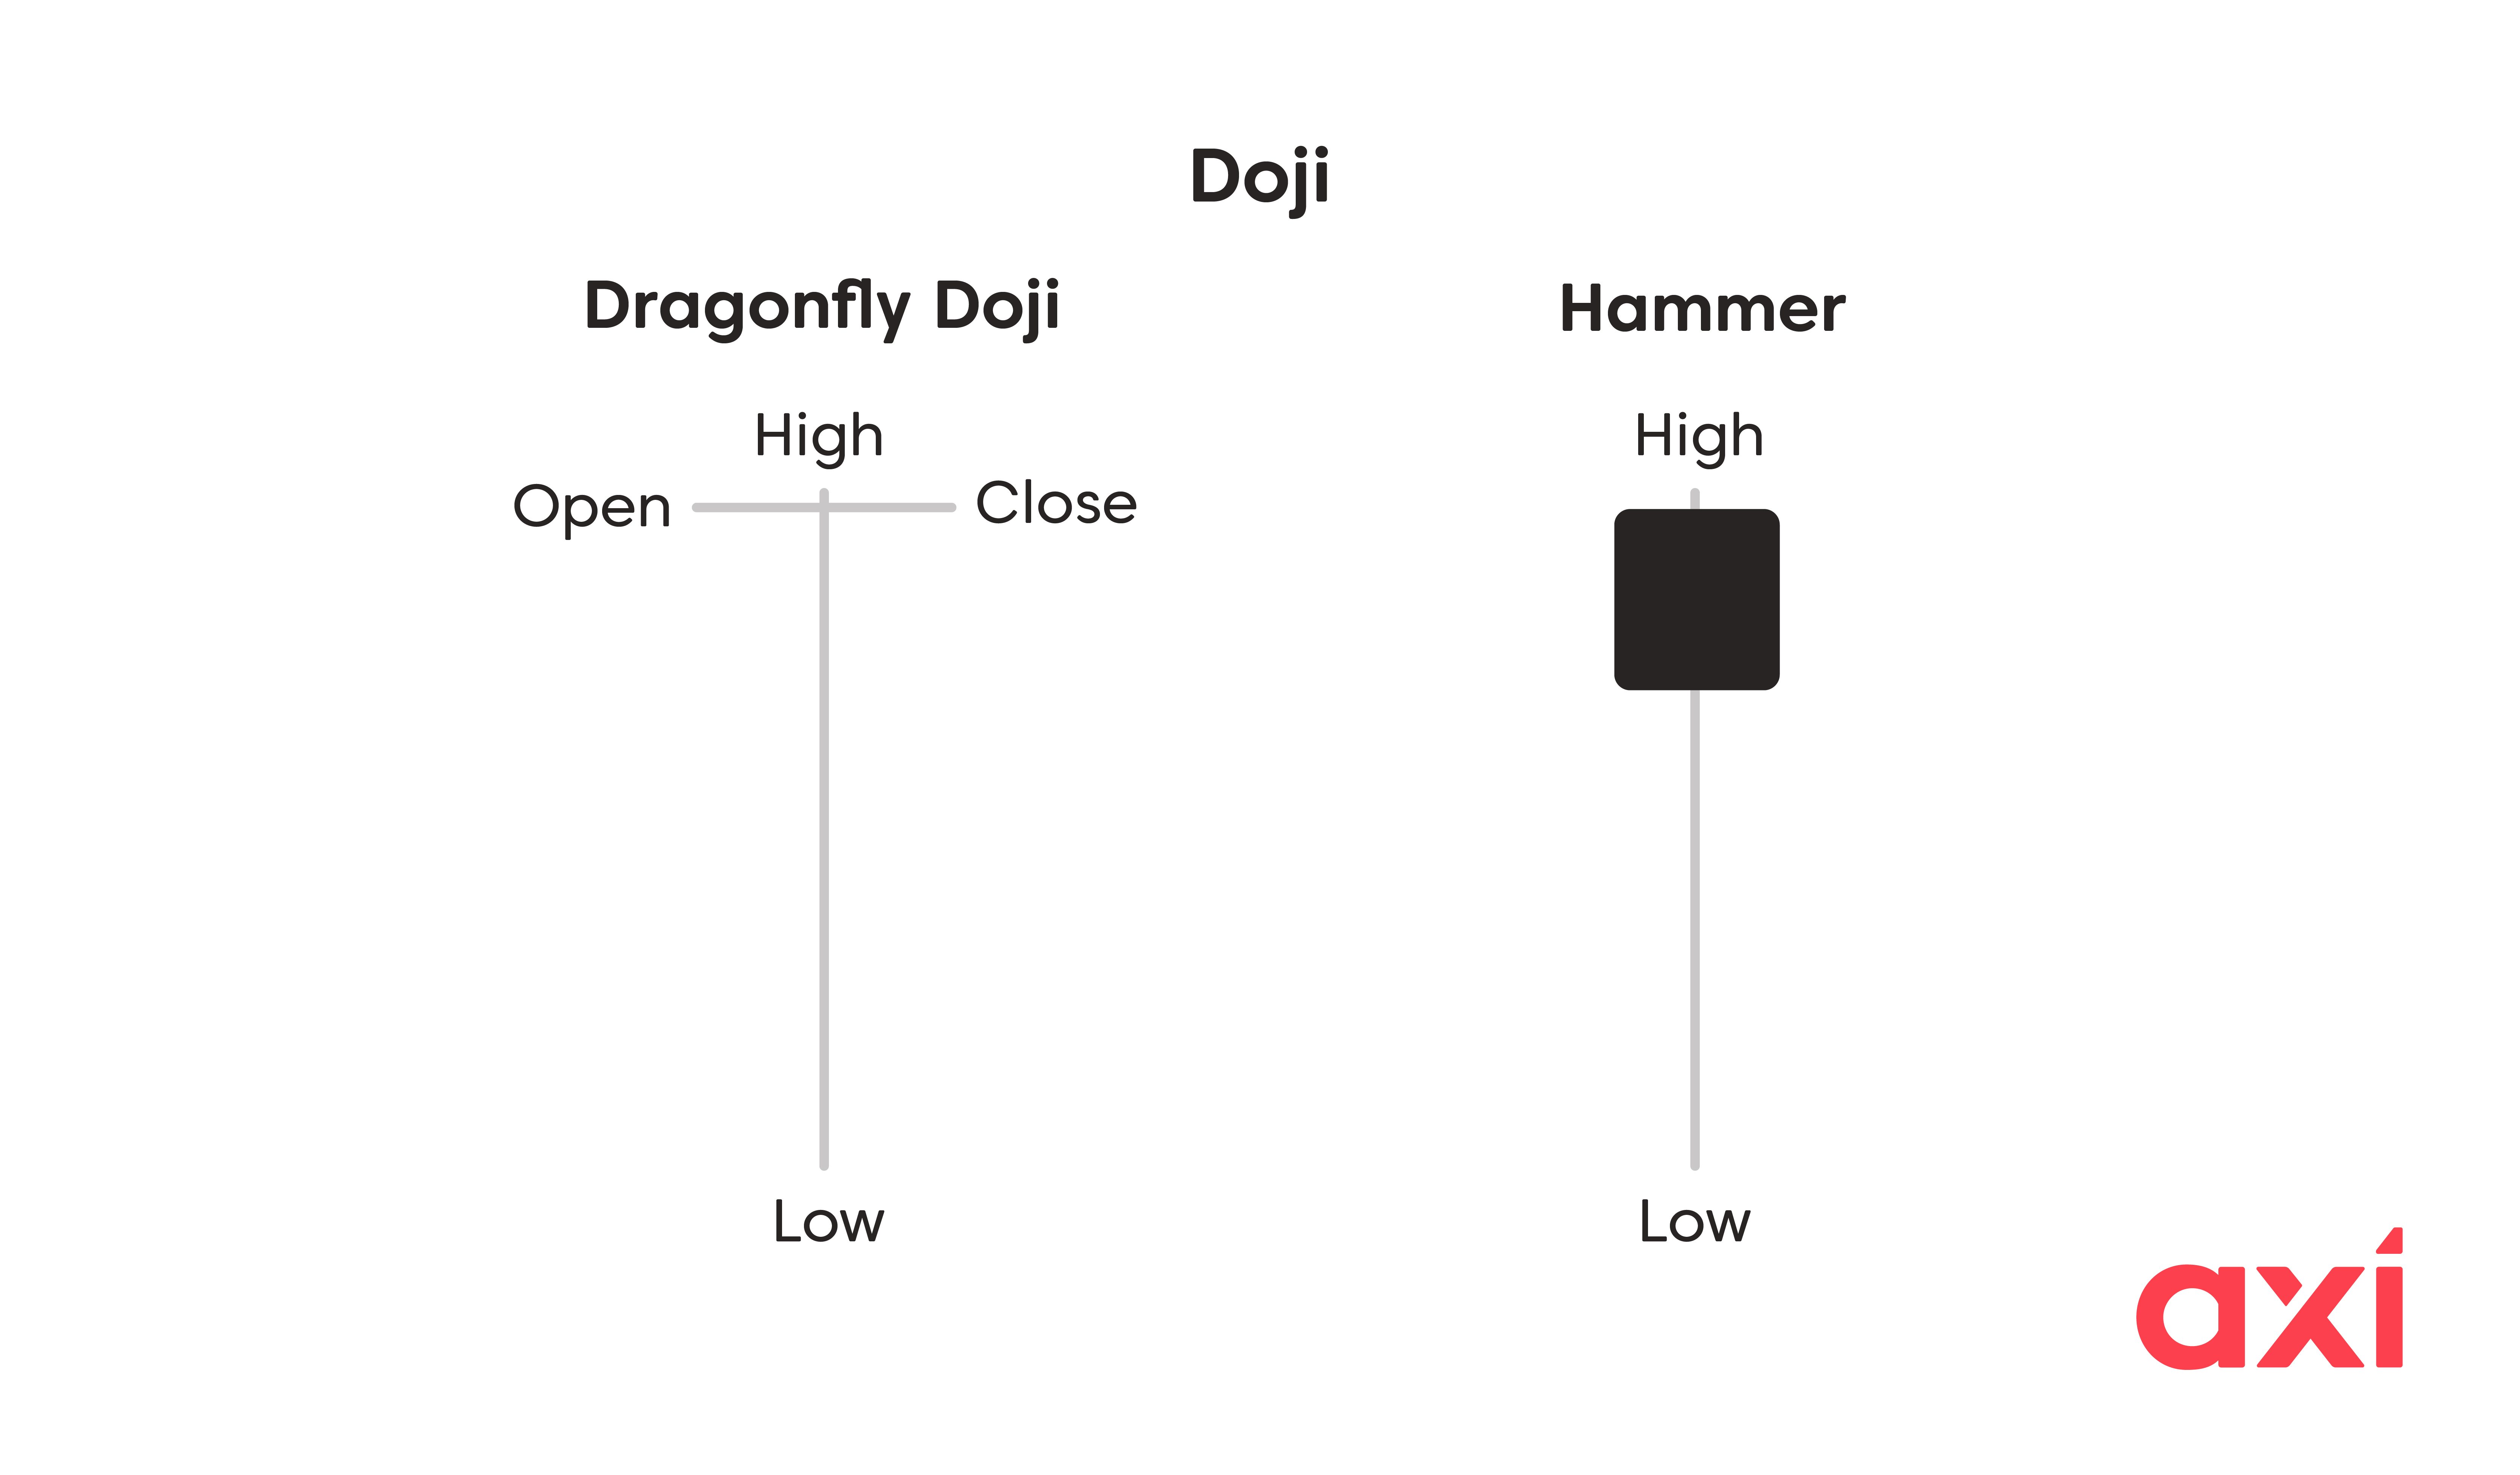
A dragonfly doji is shaped like the letter "T". The open, high, and close prices of the candlestick are all at the same level or very close to each other.
Like other dojis, the dragonfly doji has little to no real body. It's marked by a long lower shadow that is much larger than its body and a very short or absent upper shadow.
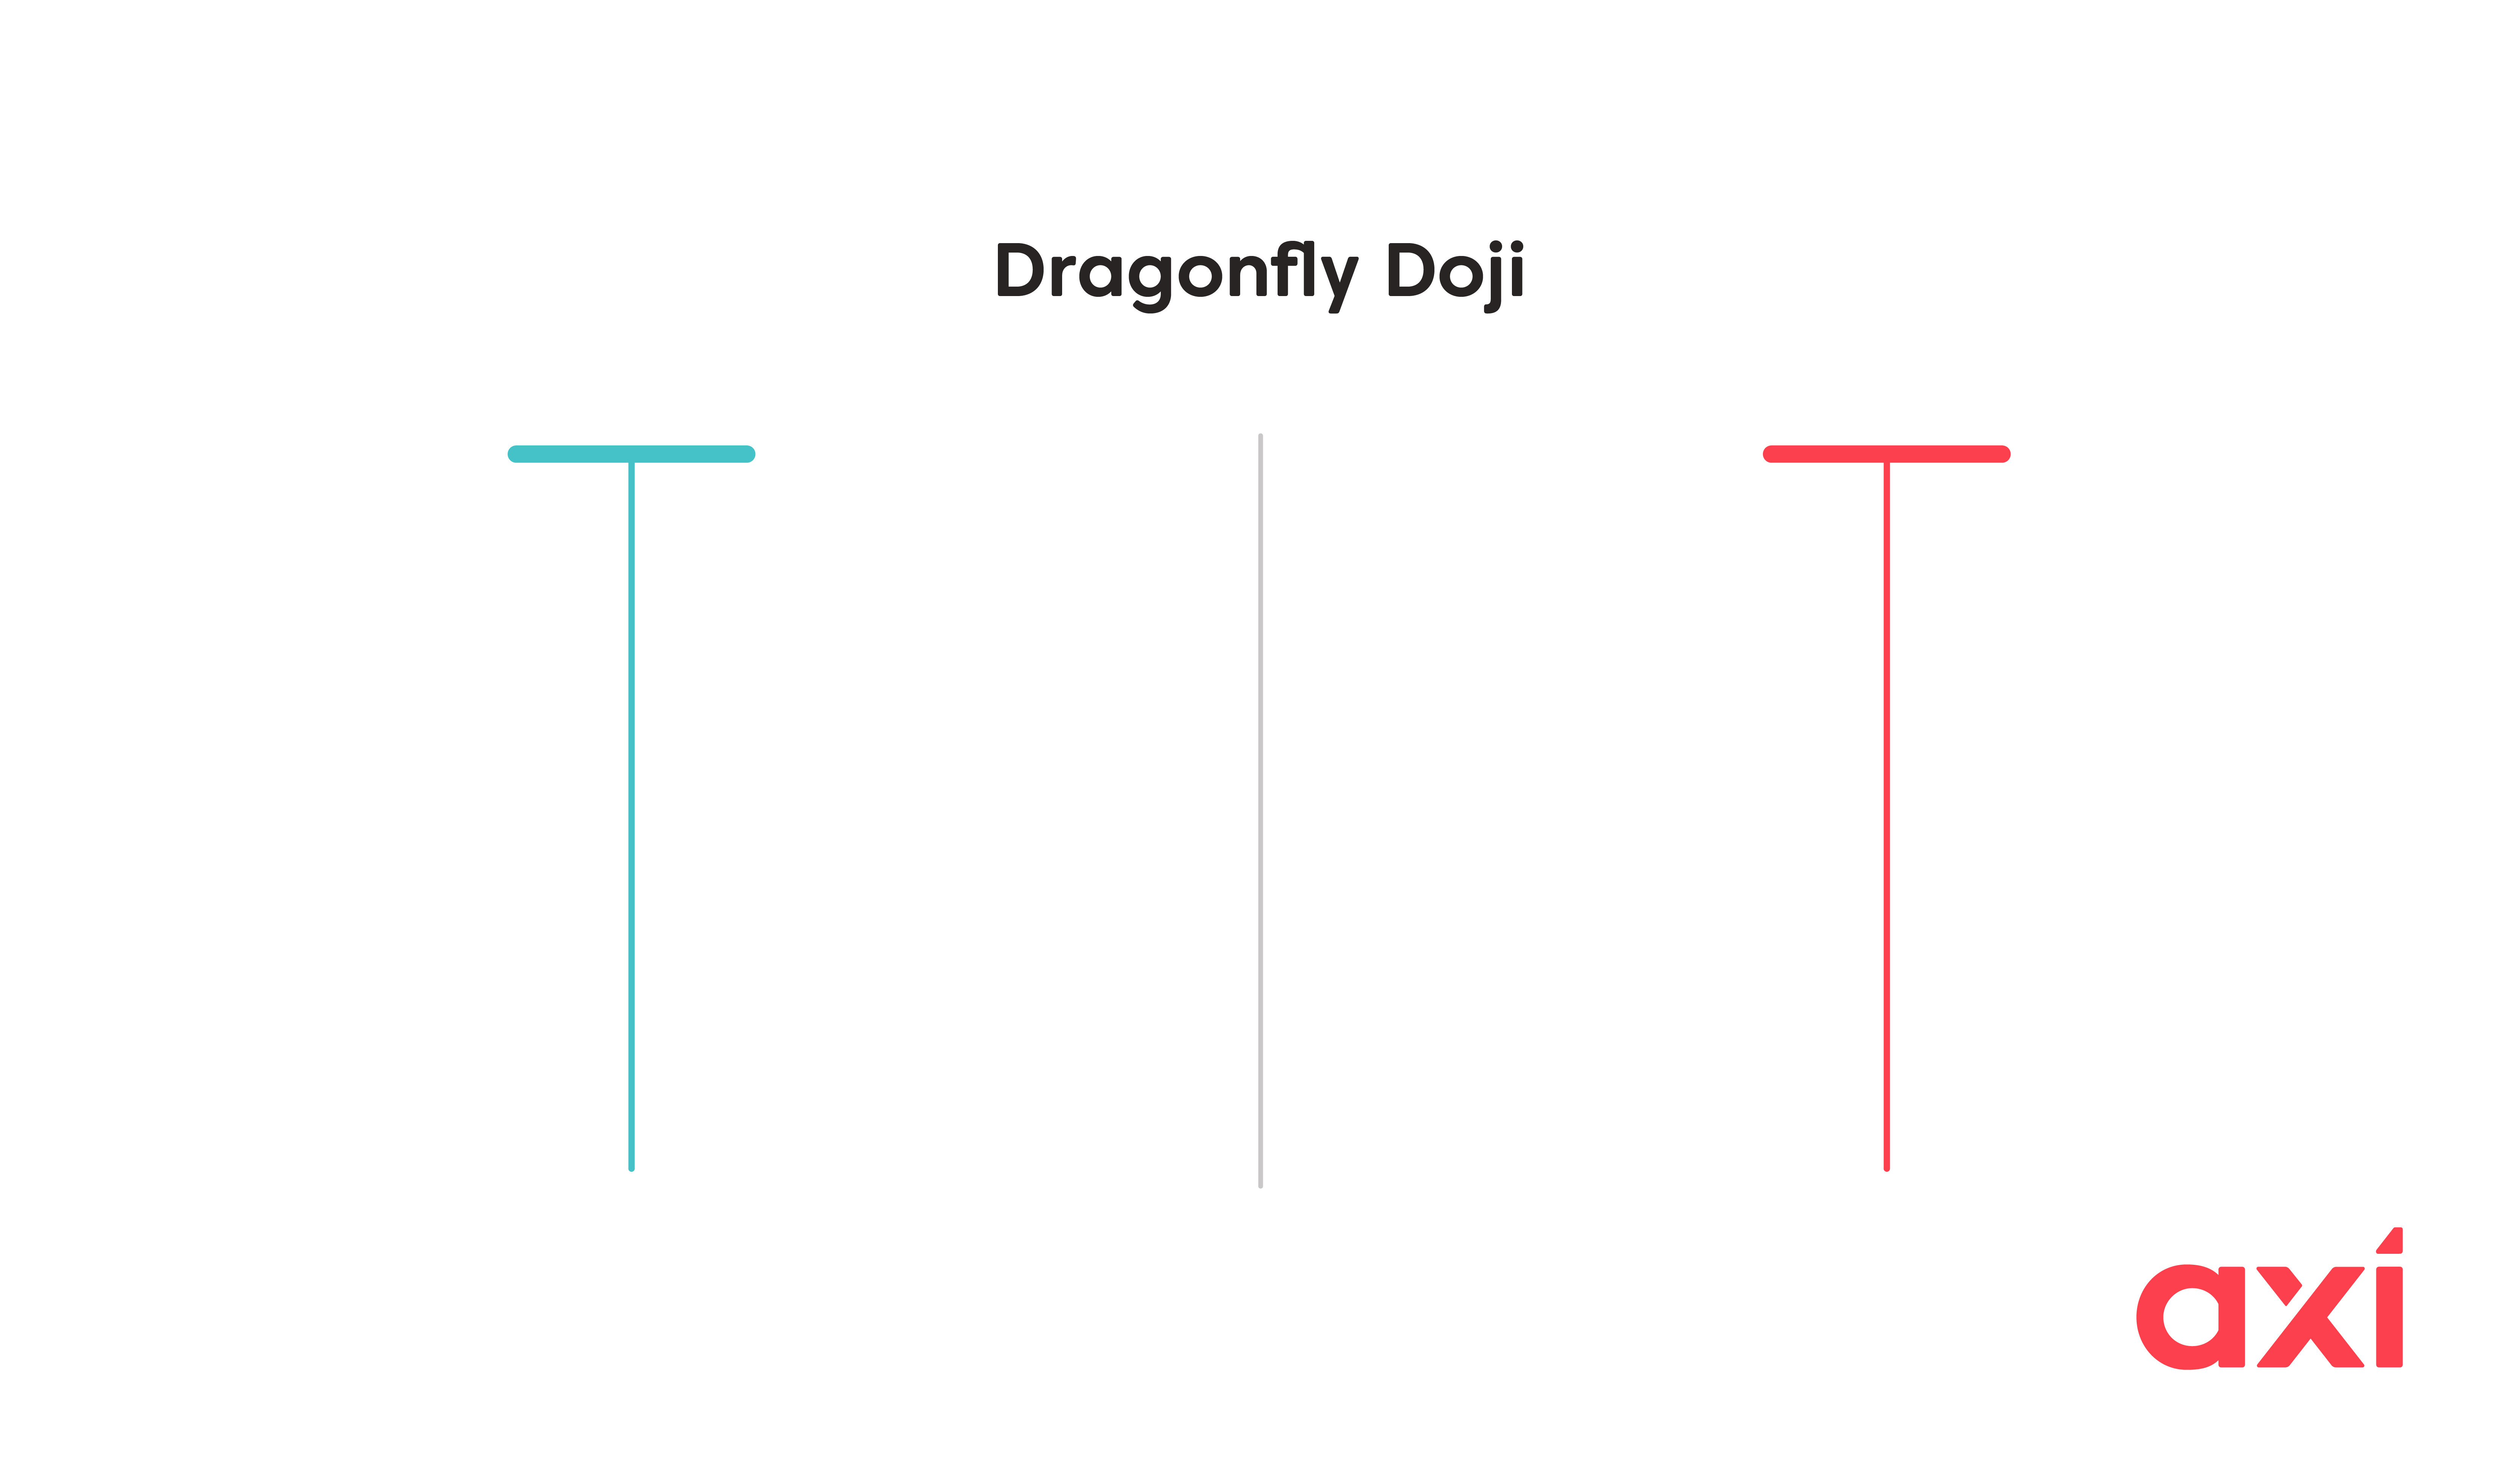
The dragonfly doji indicates a strong shift in market sentiment. Sellers were initially able to push the price down significantly, but buyers eventually took control and forced the price back to the opening level of the candlestick. The candle eventually closes at the same level or very close to it, indicating that buyers remained in control until the end of the session.
A bullish candle following the dragonfly doji serves as confirmation. It signals that buyers have indeed taken sustained control and are continuing to push prices higher.
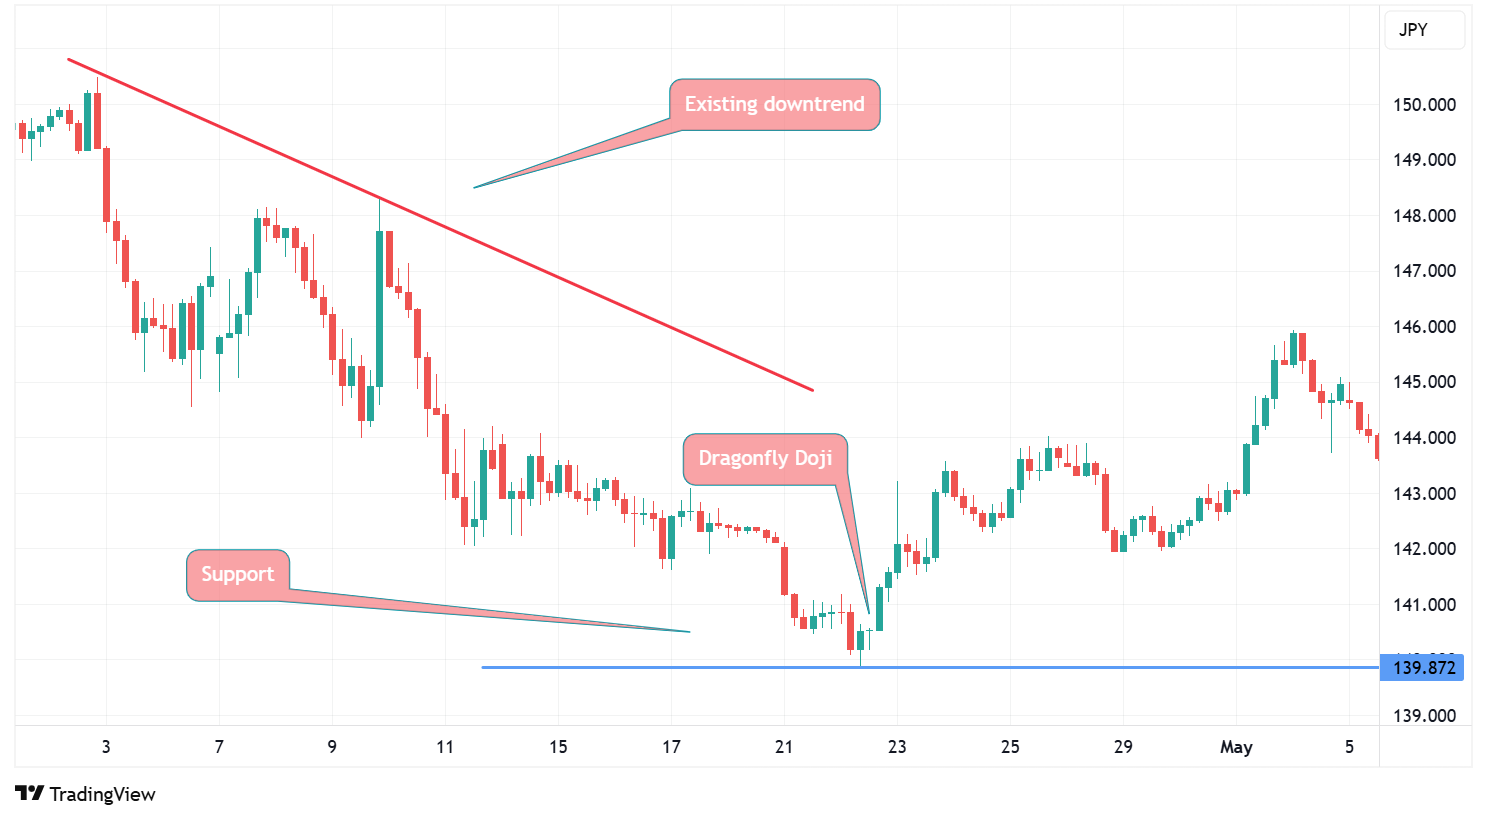
A dragonfly doji appears near the end of a downtrend. While it consists of only one candlestick, it is a pattern worth paying attention to, as the price action tells us that sellers have rapidly lost control and bearish momentum is waning.
Before considering a dragonfly doji as a valid reversal signal, the trading instrument must be in an established downtrend. If the Dragonfly doji appears during a consolidation phase (a period of sideways price movement), it becomes unreliable. In such a scenario, the market already exhibits indecision. Which means the dragonfly doji would not provide any valuable insights.
The dragonfly doji appears less frequently than the plain doji or similar candlestick patterns. This rarity is due to its specific requirements: a long lower shadow indicating significant volatility, coupled with open, high, and close prices that are nearly identical. Such a precise alignment of price action is uncommon.
The dragonfly doji is considered a more trustworthy pattern than the plain doji because it appears less frequently. Its rarity naturally attracts more attention from traders, whereas the plain doji, which occurs often, can sometimes be dismissed as mere market indecision.
The dragonfly doji can be a reliable pattern, but it is important to ensure that the traded instrument is in an existing downtrend and to wait for the confirmation candle that follows the dragonfly doji.
While false signals can occur, traders can take a few steps to improve the pattern’s reliability:
Evaluate the strength of the underlying trend: A dragonfly appearing during a strong downtrend is preferable.
Check for proximity to key support levels: If the dragonfly doji appears near a key support level, it is considered a positive sign.
Analyse accompanying technical indicators: for example, if the Relative Strength Index (RSI) is already in oversold territory when the dragonfly doji appears, it significantly improves the odds of a bullish reversal.
To understand the price action behind the dragonfly doji, we can split it up into stages.
The session starts with sellers aggressively pushing the price lower.
The price then reaches a notable low, resulting in the formation of the long lower shadow.
At this point, buyers enter the market and start to push the price upwards.
Sellers are unable to maintain their position, leading to a recovery rally initiated by the buyers.
The session ends with the price closing at or near the opening price.
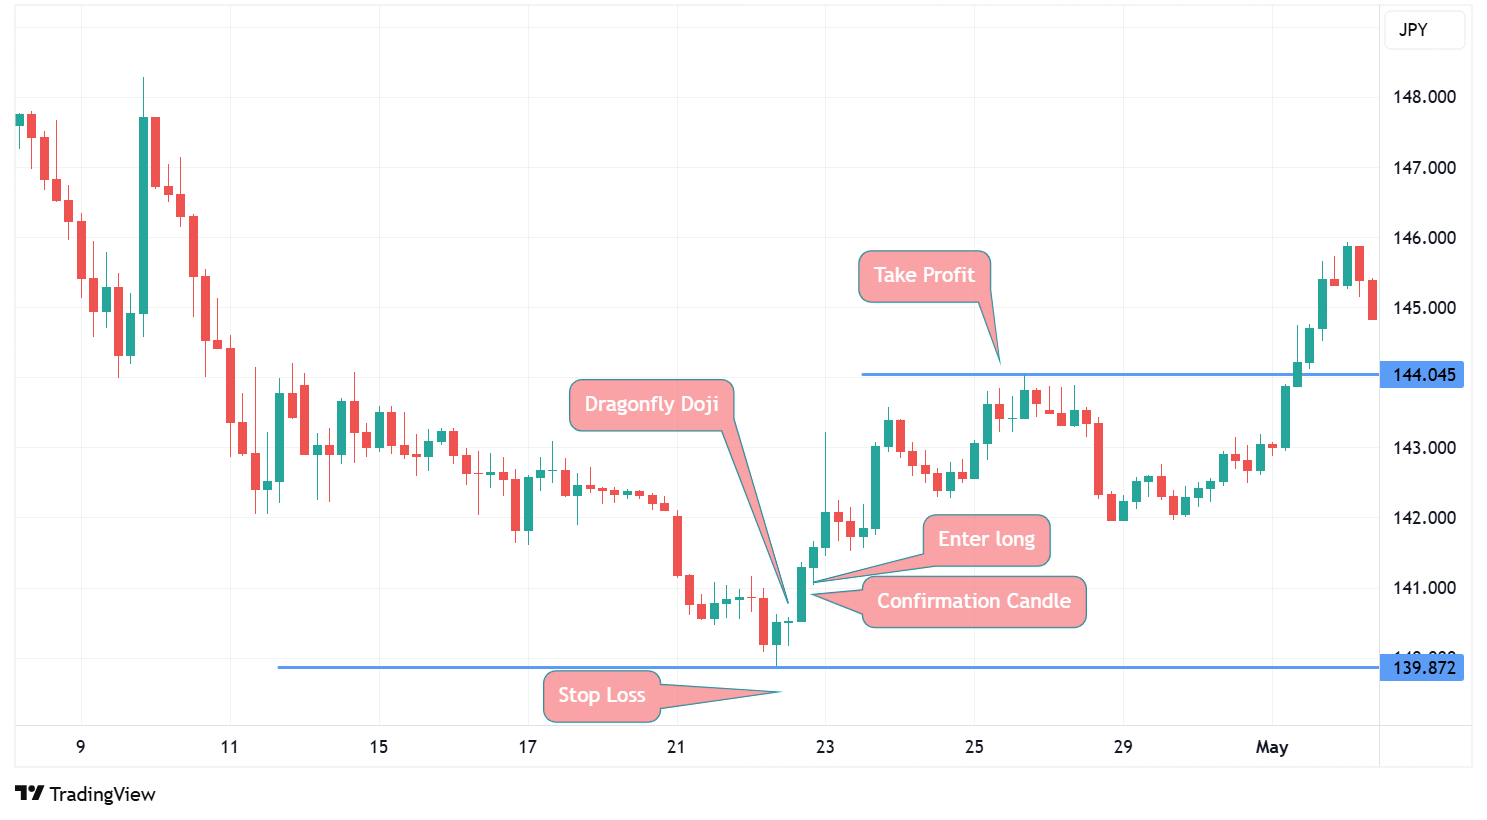
Once you have identified a dragonfly doji on the charts, ensure that the instrument is in a downtrend. Dragonfly dojis are less reliable when markets are moving sideways and should therefore be avoided.
The next step is to make use of supporting tools. While it is not necessary for the dragonfly doji to appear near a key support level to make it a valid signal, it improves the odds of a bullish reversal.
Traders often use additional technical indicators to confirm the dragonfly doji signal. For instance, if the Relative Strength Index (RSI) is already indicating oversold conditions, this provides an advantage by significantly improving the likelihood of a market rebound from current levels.
It is important to wait for the confirmation candle before entering a long position, as relying solely on the dragonfly doji is not enough. The subsequent candle following the dragonfly doji should be a strong bullish candle that closes above the high of the previous candle. Once this is established, traders will proceed to enter a long position.
Where do we set a stop-loss order? Traders typically place it just below the low of the dragonfly doji. The placement of the take-profit order is more subjective; however, traders will generally place it at the next significant resistance level or use trailing stops.
The gravestone doji represents the inverse of the dragonfly doji. It features a long upper shadow, with the open and close prices situated at the lower end of the candle. While the dragonfly doji indicates a bullish reversal, the gravestone doji suggests a bearish reversal.
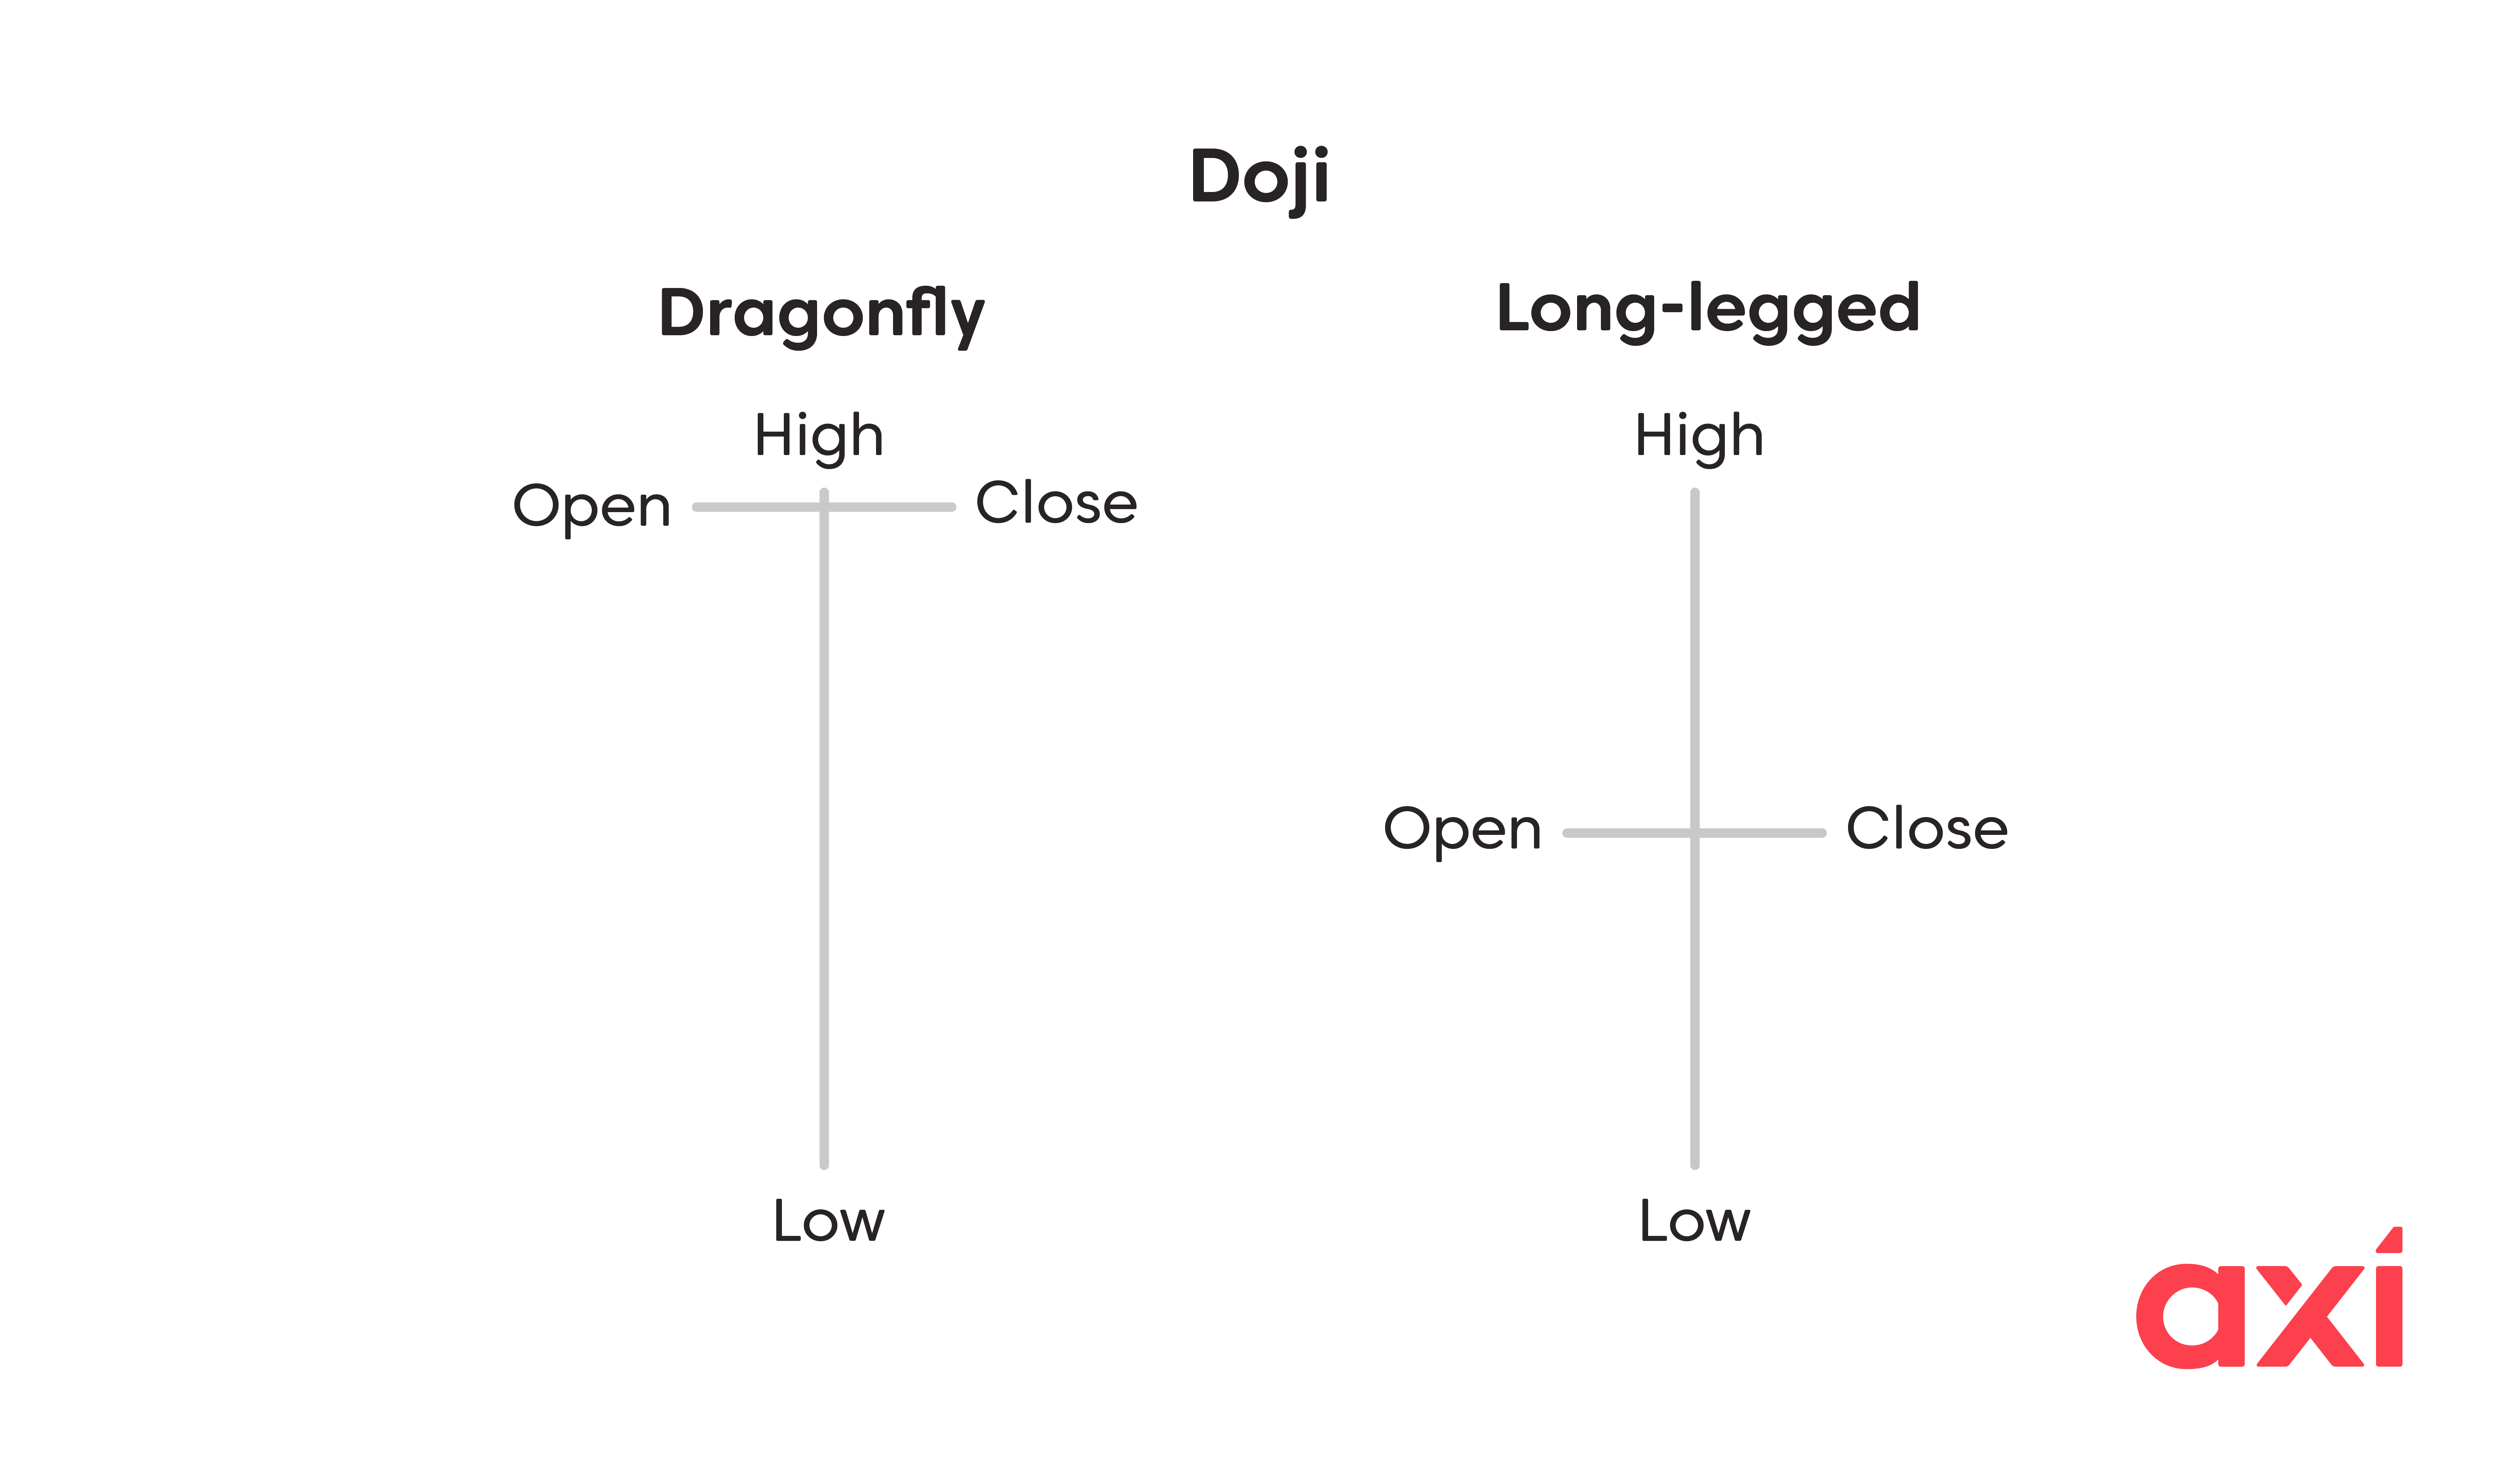
The long-legged doji signals market indecision, where neither bulls nor bears are currently in control. This version of the doji features both a long upper and lower shadow, with the open and close prices located in the middle section of the candle.
The bearish doji star consists of two candles – a strong bullish candle and a doji that gaps above the close of the first candle. It appears during an uptrend and signals a bearish reversal.
The bullish doji star also consists of two candles – a long bearish candle and a doji that gaps below the close of the first candle. As the name suggests, it appears during a downtrend and hints at a bullish reversal.
The hammer signals a bullish reversal, like the dragonfly doji. However, the hammer has a small body located in the upper part of the candlestick, a long lower shadow and little to no upper shadow.
Unlike the dragonfly doji, the shooting star signals a bearish reversal. It also has a small body located near the bottom of the range and a long upper shadow.
The dragonfly doji offers several advantages, including:
It can help traders spot a potential trend reversal.
Its easily identifiable structure.
It applies across all timeframes.
It can appear on charts of diverse trading instruments, from forex to stocks and commodities.
Despite its advantages, the dragonfly doji has also several drawbacks:
It requires the instrument to be in a downtrend.
It can appear also during periods of consolidation, but this would provide an unreliable signal.
Its shape is not always "perfect", so there can be variations in appearance.
As with any pattern, false signals can occur.
A dragonfly doji is a candlestick pattern that signals a potential bullish trend reversal. It has a distinctive shape resembling the letter "T" and typically appears towards the end of a downtrend.
Dragonfly dojis can appear across all chart timeframes and for various instruments. However, it is advisable not to trade solely based on the dragonfly doji; instead, traders should wait for a confirmation candle, which is a strong bullish candle that appears immediately following the dragonfly doji.
Ready to trade your edge?
Join thousands of traders and trade CFDs on forex, shares, indices, commodities, and cryptocurrencies!
This information is not to be construed as a recommendation; or an offer to buy or sell; or the solicitation of an offer to buy or sell any security, financial product, or instrument; or to participate in any trading strategy. It has been prepared without taking your objectives, financial situation and needs into account. Any references to past performance and forecasts are not reliable indicators of future results. Axi makes no representation and assumes no liability with regard to the accuracy and completeness of the content in this publication. Readers should seek their own advice.
FAQ
A dragonfly doji is a candlestick pattern that signals a bullish trend reversal.
A dragonfly doji features a long lower shadow and little to no upper shadow. The open, close, and high prices are at the same or nearly the same level.
Sellers were initially able to price significantly lower, but buyers were able to gain control and pushed prices back towards the open price.
Confirm that the instrument is in a downtrend. Once the dragonfly doji appears, wait for the confirmation candle. Once the confirmation candle has closed, enter a long position and place the stop-loss order below the low of the dragonfly doji.
Various indicators can be used in conjunction with the dragonfly doji, with the most popular being the RSI, MACD and moving averages.

