
Login with email
Login
Login with your email or your MT4 credentials.
The Average Directional Index, or ADX for short, is a technical indicator that assists traders in identifying the strength of a trend, irrespective of its direction. A rising ADX indicates the development of a trend, whether it’s an uptrend or downtrend.
The ADX is generally used as a supporting tool. It can be easily combined with other technical indicators like the RSI and MACD and is used by both short- and long-term traders.
For this example, we will use a 14-period setting.
First, we need to measure the extent of the price increase (+DM) and the extent of the price decrease (-DM).
(Only one of these will be counted each day — never both.)
Next, we will calculate the average of these measurements over a 14-day period.
To do this, we smooth out the values over 14 days to get a more stable view of how the price has been moving up or down.
This is done by starting with a simple average and then updating it with each new day's value, giving more weight to recent days.
The DIs are then calculated as follows:
These tell us how strong the upward or downward moves have been.
After this, we want to figure out the DX (directional index), which is the difference between +DI and -DI (ignoring the minus sign), divided by the total of +DI and -DI, and then converted into a percentage.
This gives a sense of how strongly the market is trending in one direction versus being balanced or choppy.
Lastly, we calculate the ADX by averaging the previous 14 DX values.
This means we take the DX values over 14 periods and smooth them using a similar averaging method, as before, to get the ADX.
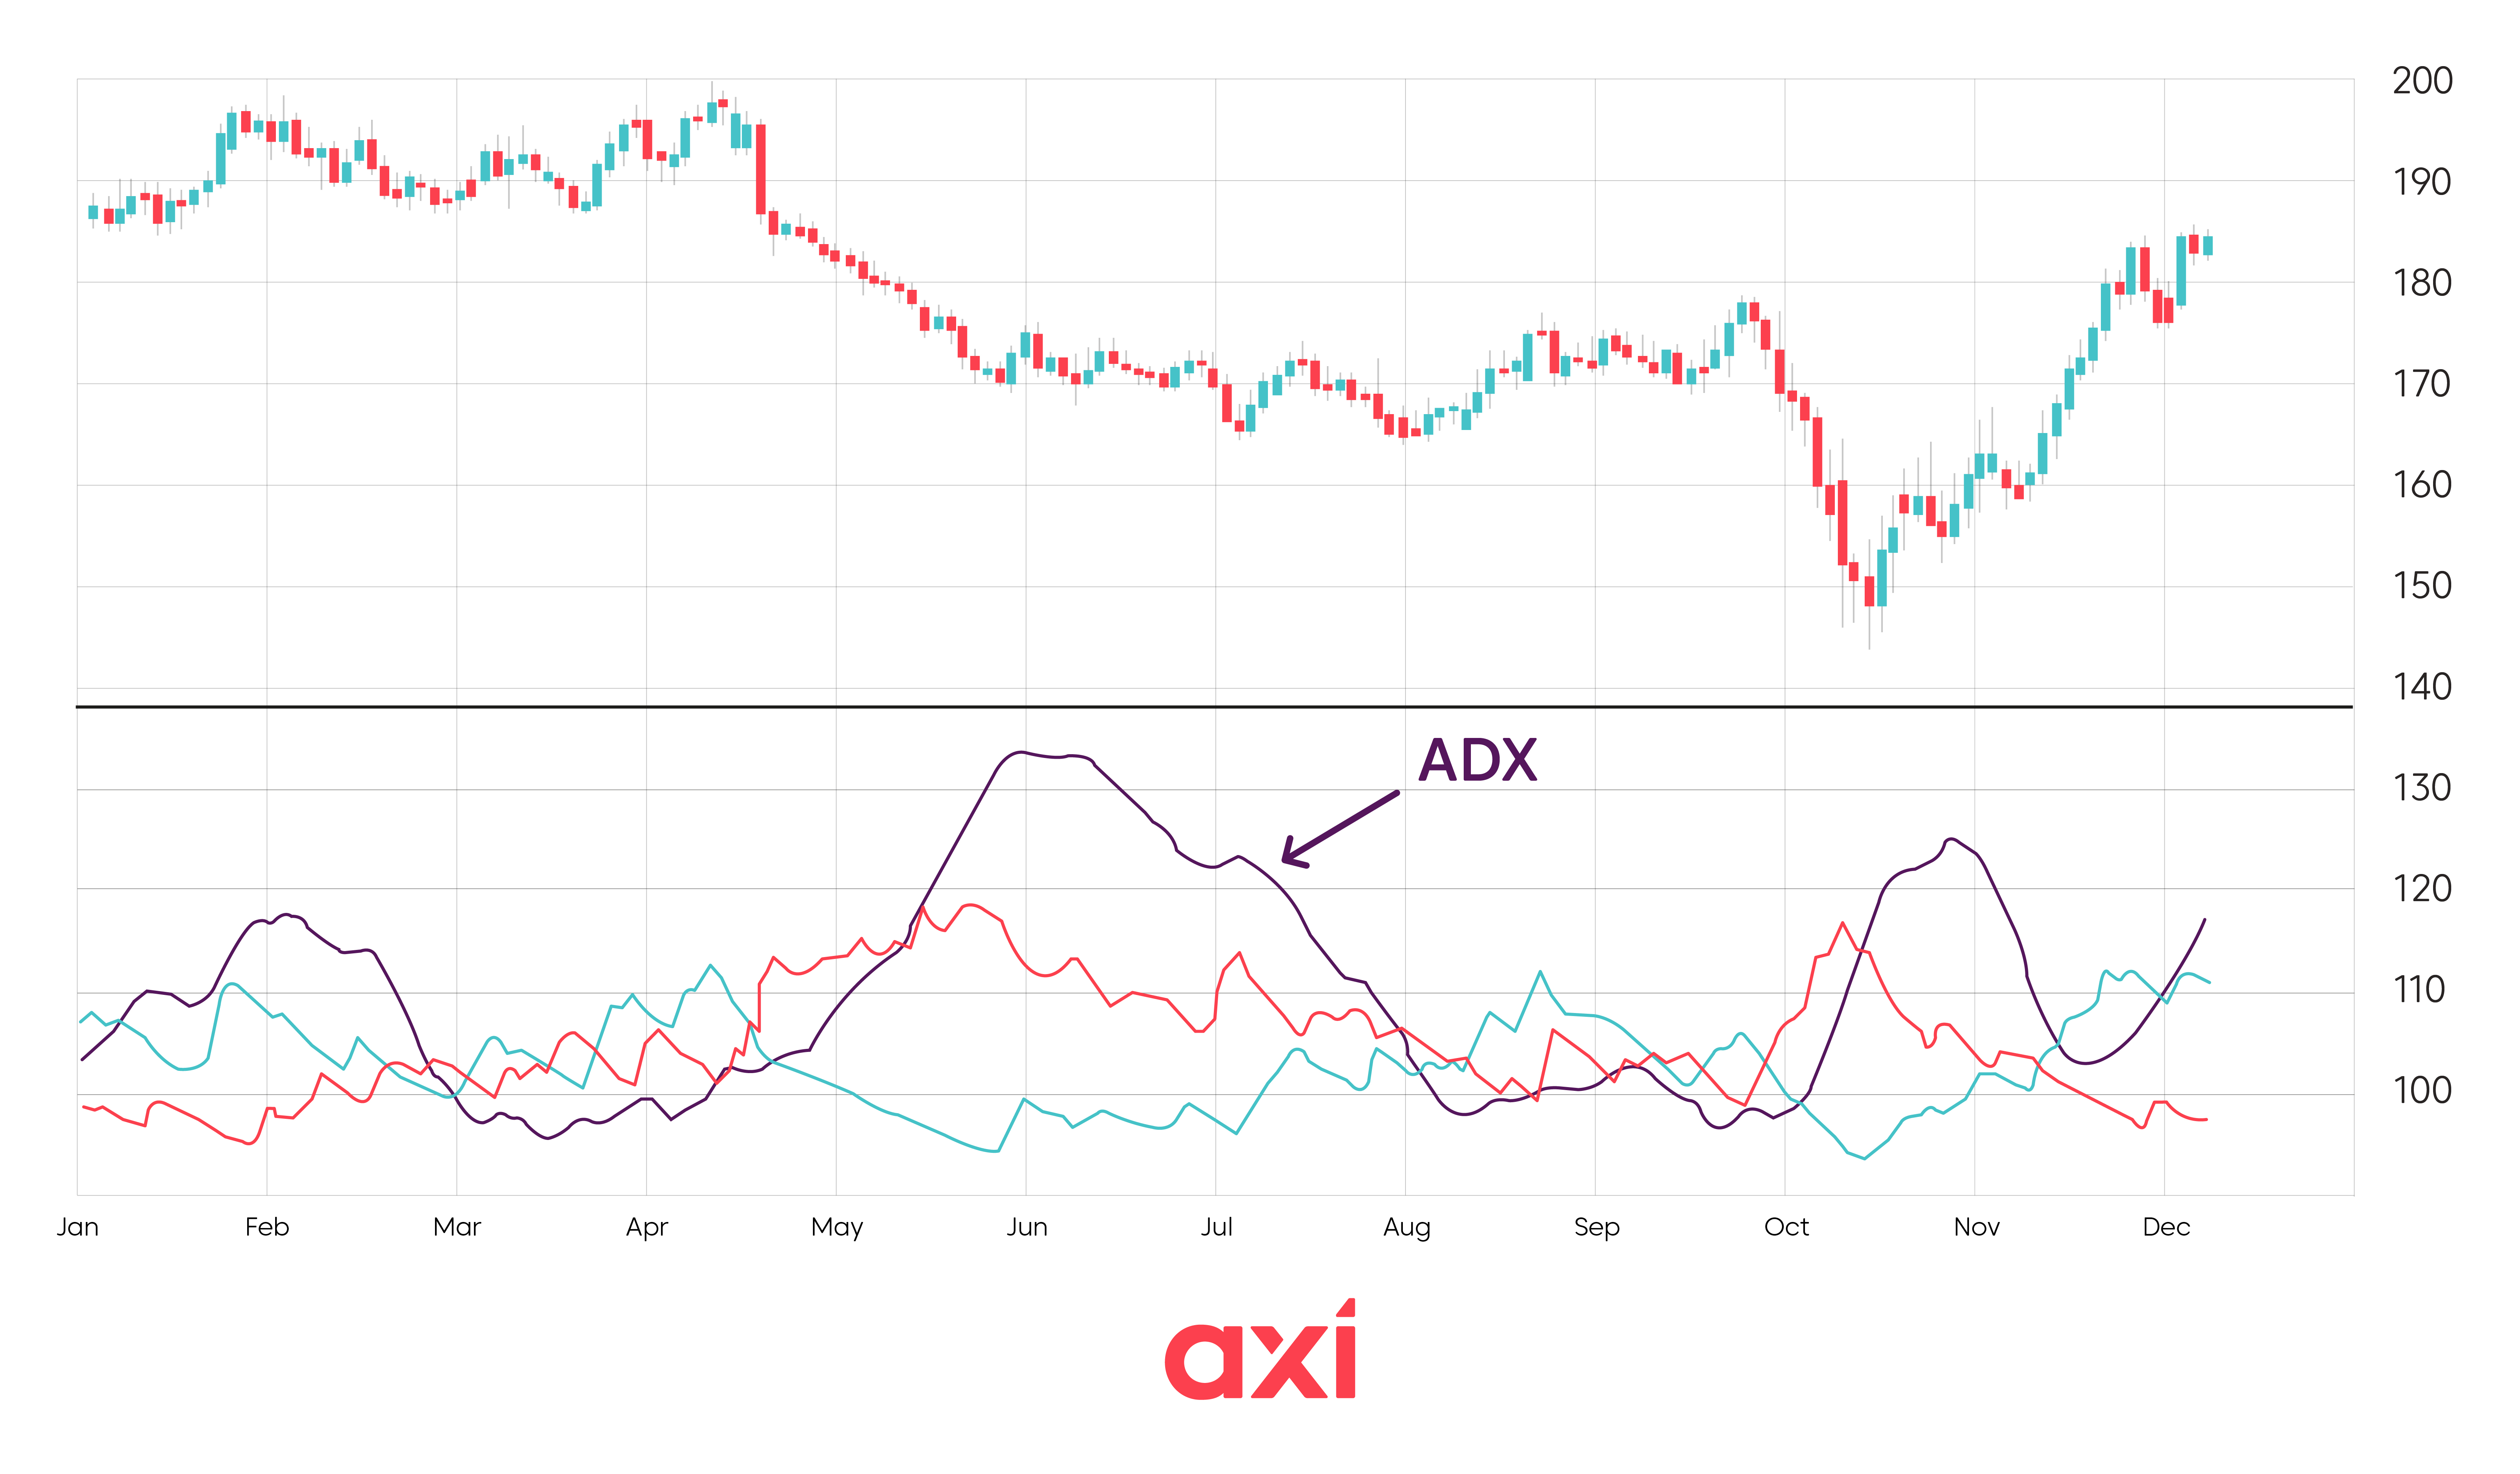
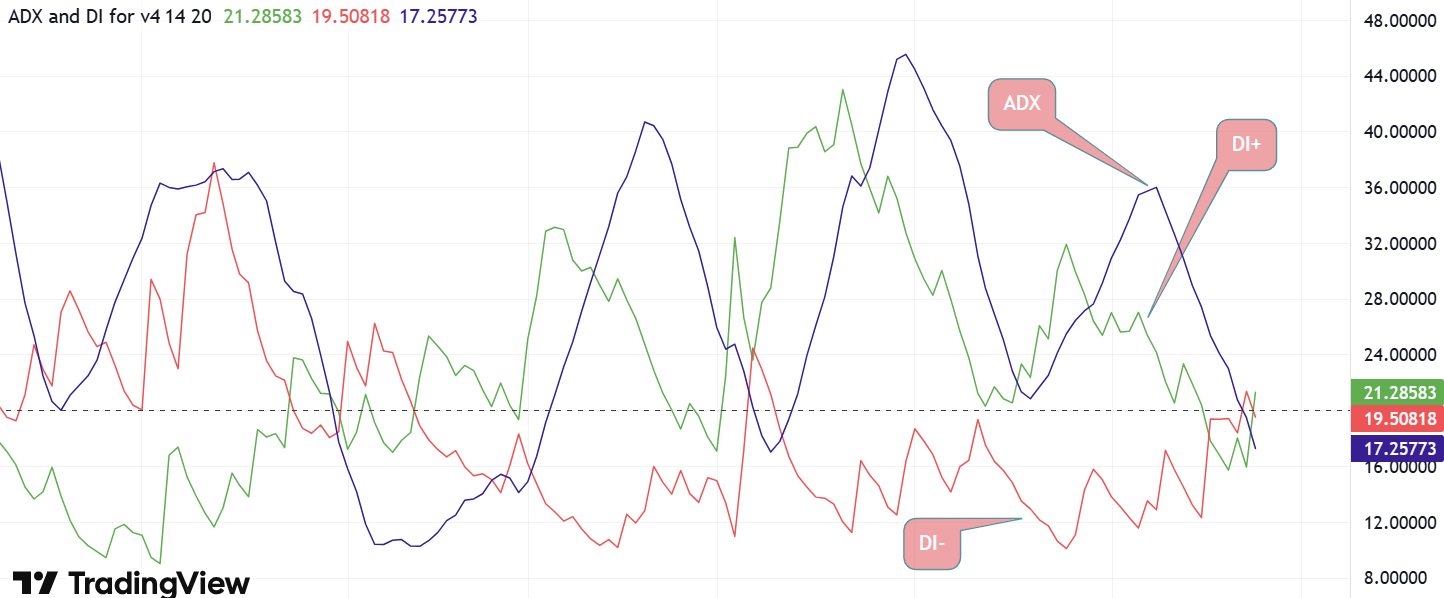
The ADX consists of three lines:
These three lines are usually shown together on a chart, which helps traders see both the direction of the trend and how strong it is.
With that in mind, the ADX gives us a single number—a value between 0 and 100—that tells us how strong the trend is. Here's how to interpret it:
To understand the direction of the trend:
The distance between the +DI and -DI lines also tells us something. A wider gap between them suggests a stronger directional move.
Other useful insights:
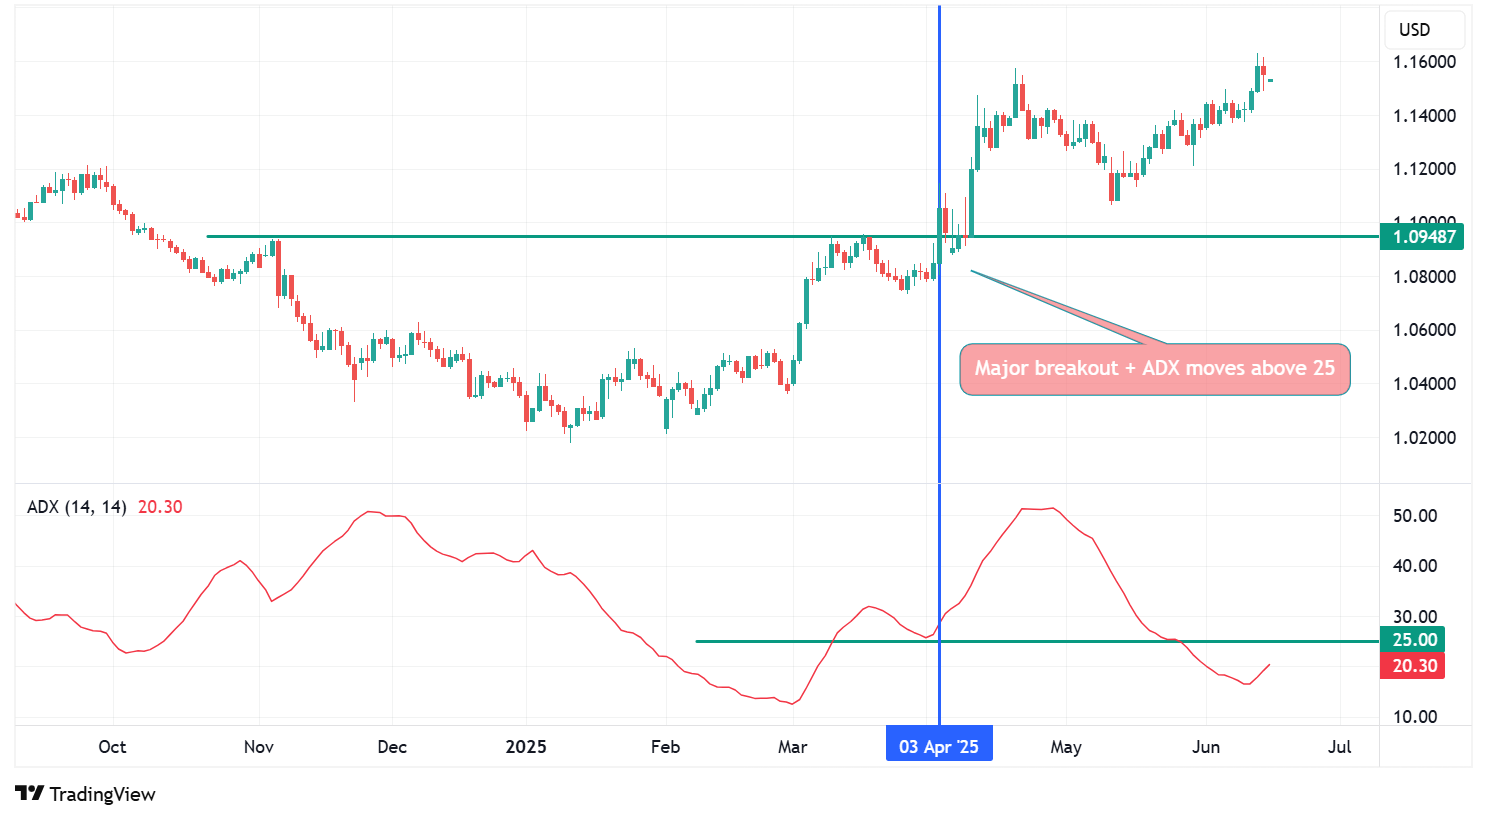
However, these crossovers only matter when the ADX is above 25 — in other words, when a real trend exists.
The ADX indicator is special because it is versatile and can be used by all traders.
Let’s take three different traders and see how they are incorporating ADX in their trading:
Trader A specialises in range trading, identifying markets that are range-bound and anticipated to stay within the same price range. Trader A is looking to buy the instrument in the lower part of the range and to sell the instrument in the upper part of the range, anticipating that price will not break out outside of the pre-established range.
To assist with his decision-making, he is using the Relative Strength Index (RSI) to filter trade signals so that he only buys the instrument if it is in oversold territory and only sells it if it’s in overbought territory. Furthermore, he uses the ADX to identify instruments that are currently not trending, i.e., have a value below 25.
Here is an example of a trading instrument that would fit Trader A’s requirements:
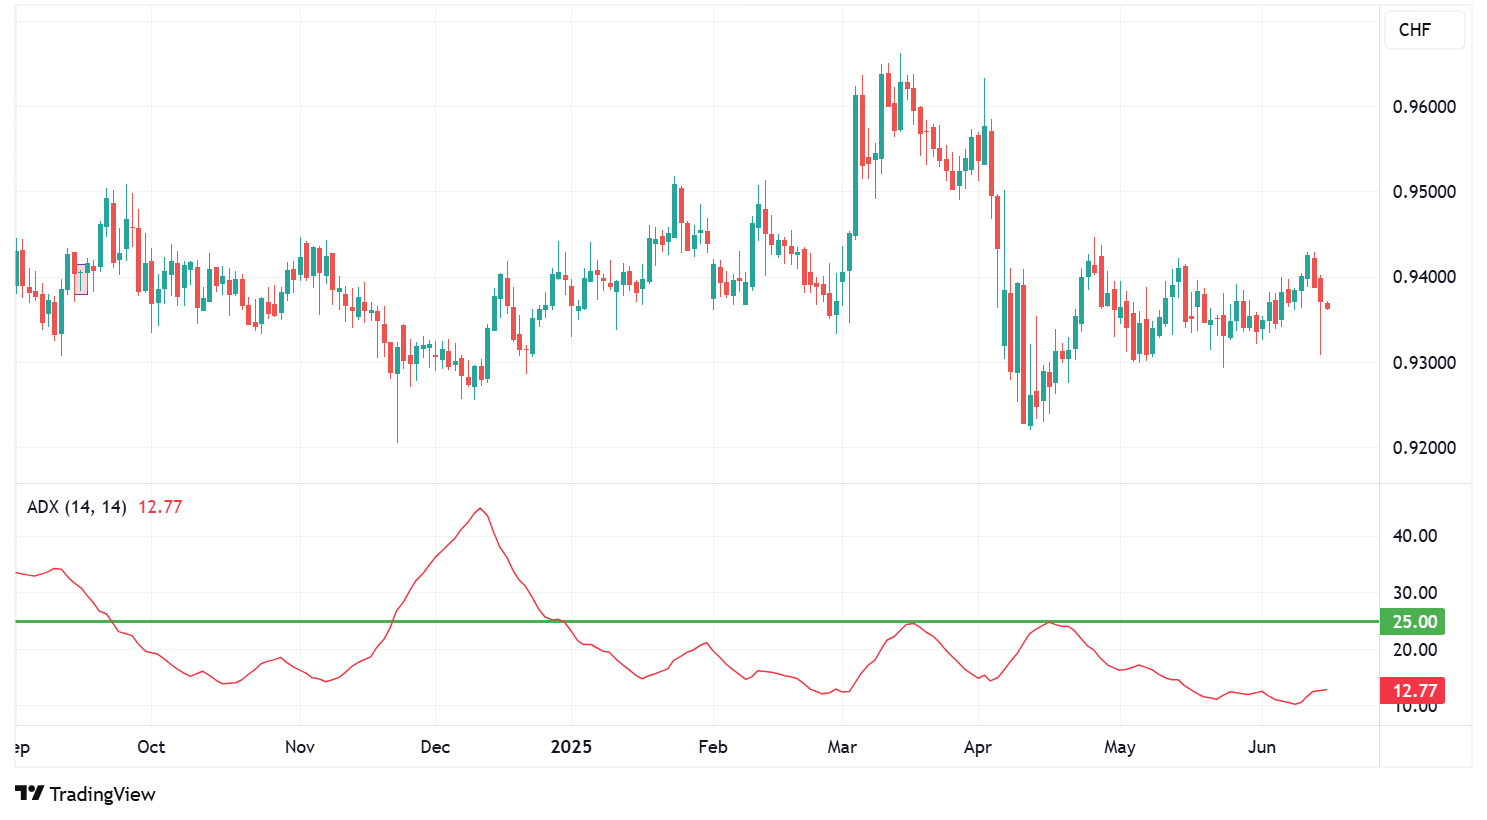
As we can see, the instrument is consolidating, and the ADX is below 25, making it a suitable choice for Trader A.
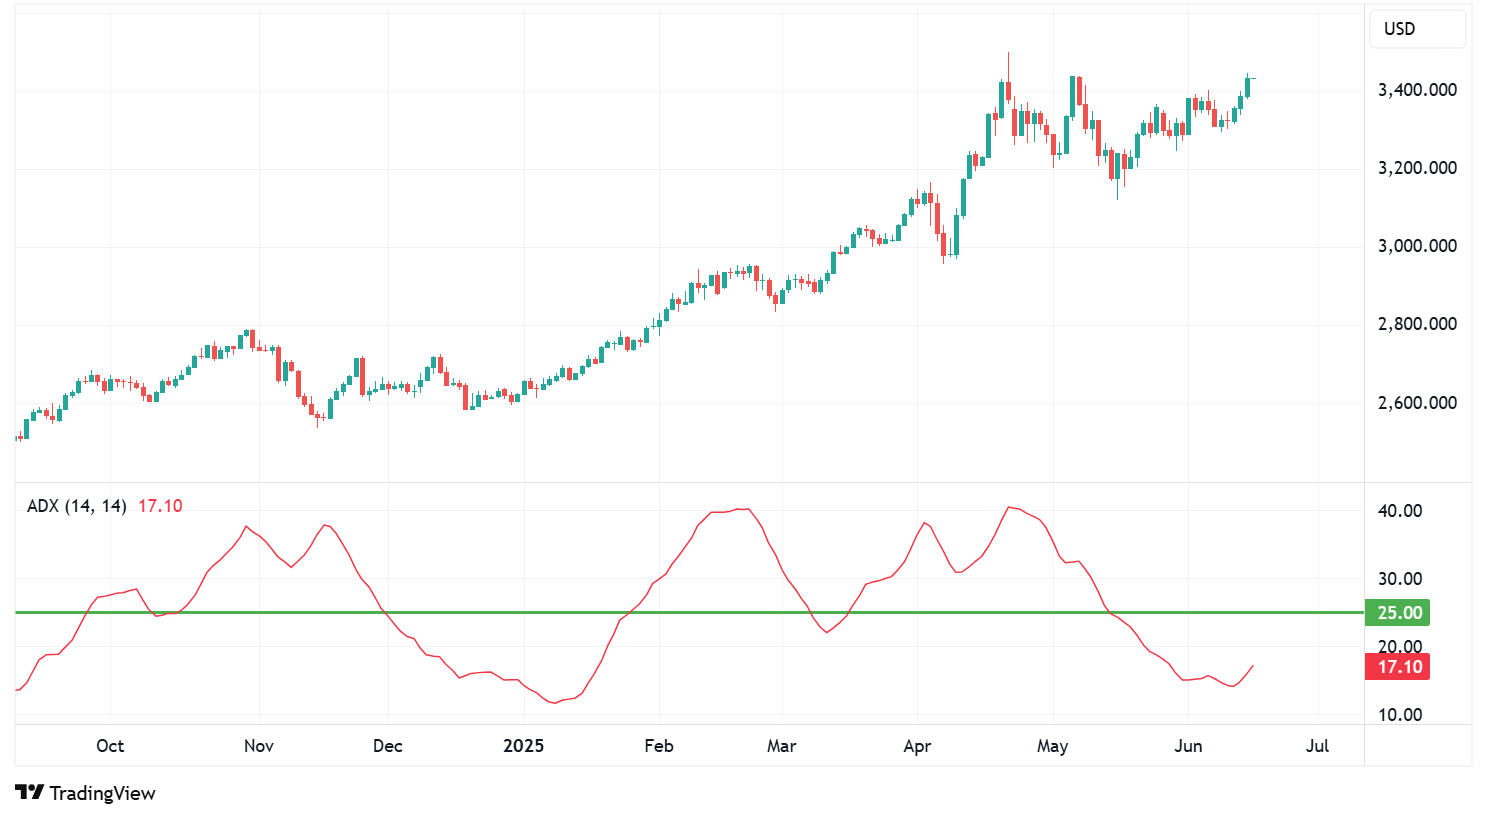
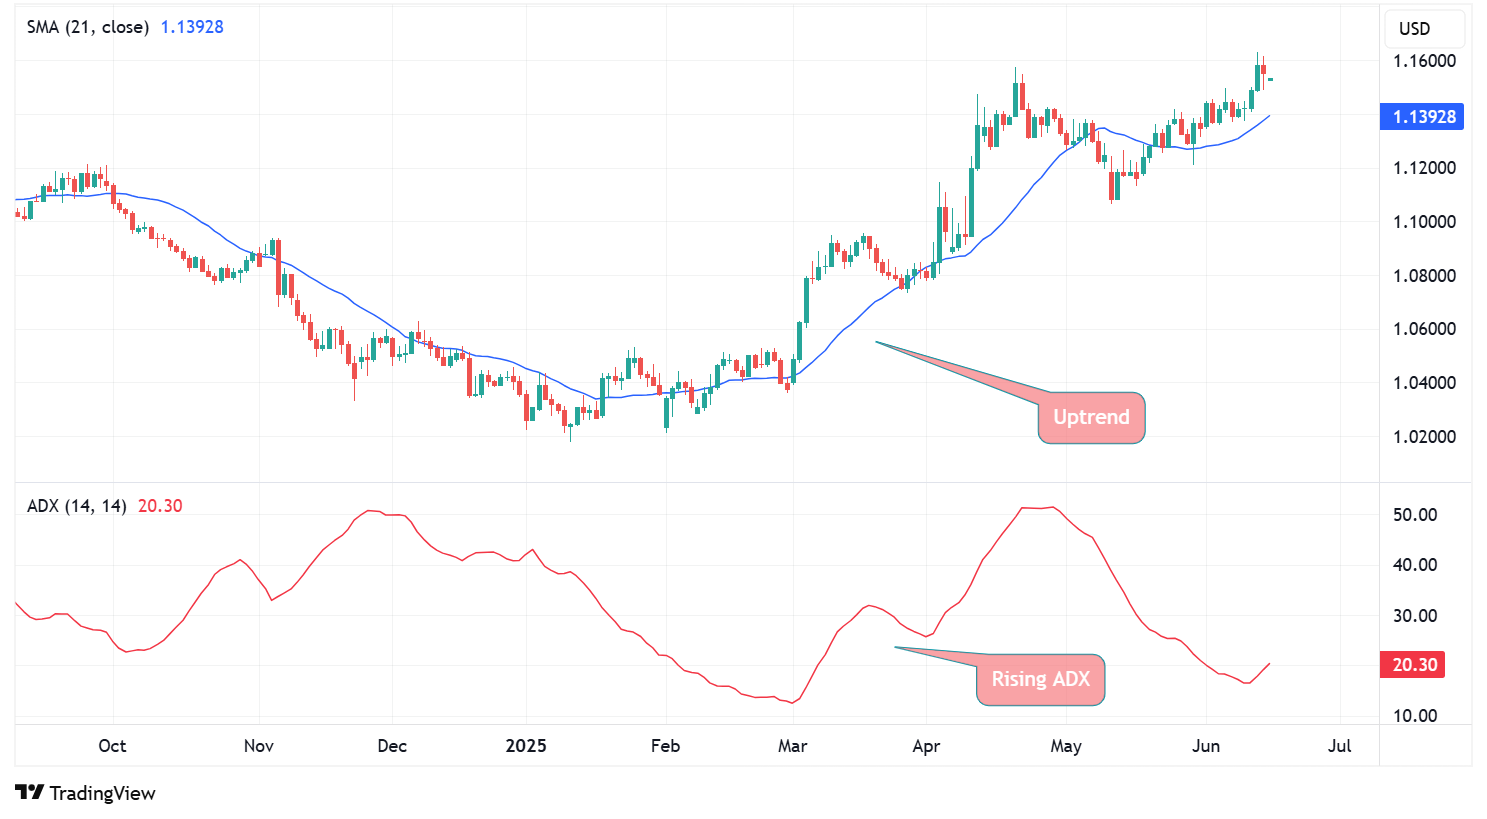
Trader B has a trend-following strategy and is trying to benefit from price swings to enter trades in the direction of the existing trend. The ADX indicator helps her to identify the strength of the trend and to focus on currency pairs that have a strong trend, improving the quality of her trades.
Trader C is a momentum trader focusing on trading breakouts. Since ranging markets produce many false breakouts, he wants to avoid those and focus on markets with an existing trend. He uses the ADX to ensure that the market conditions are right for him to deploy his breakout strategy.
Moving averages help traders visualise the current trend by smoothing out price data over time. When combined with the ADX:
Together, they allow traders to confirm both the direction and validity of a trend.
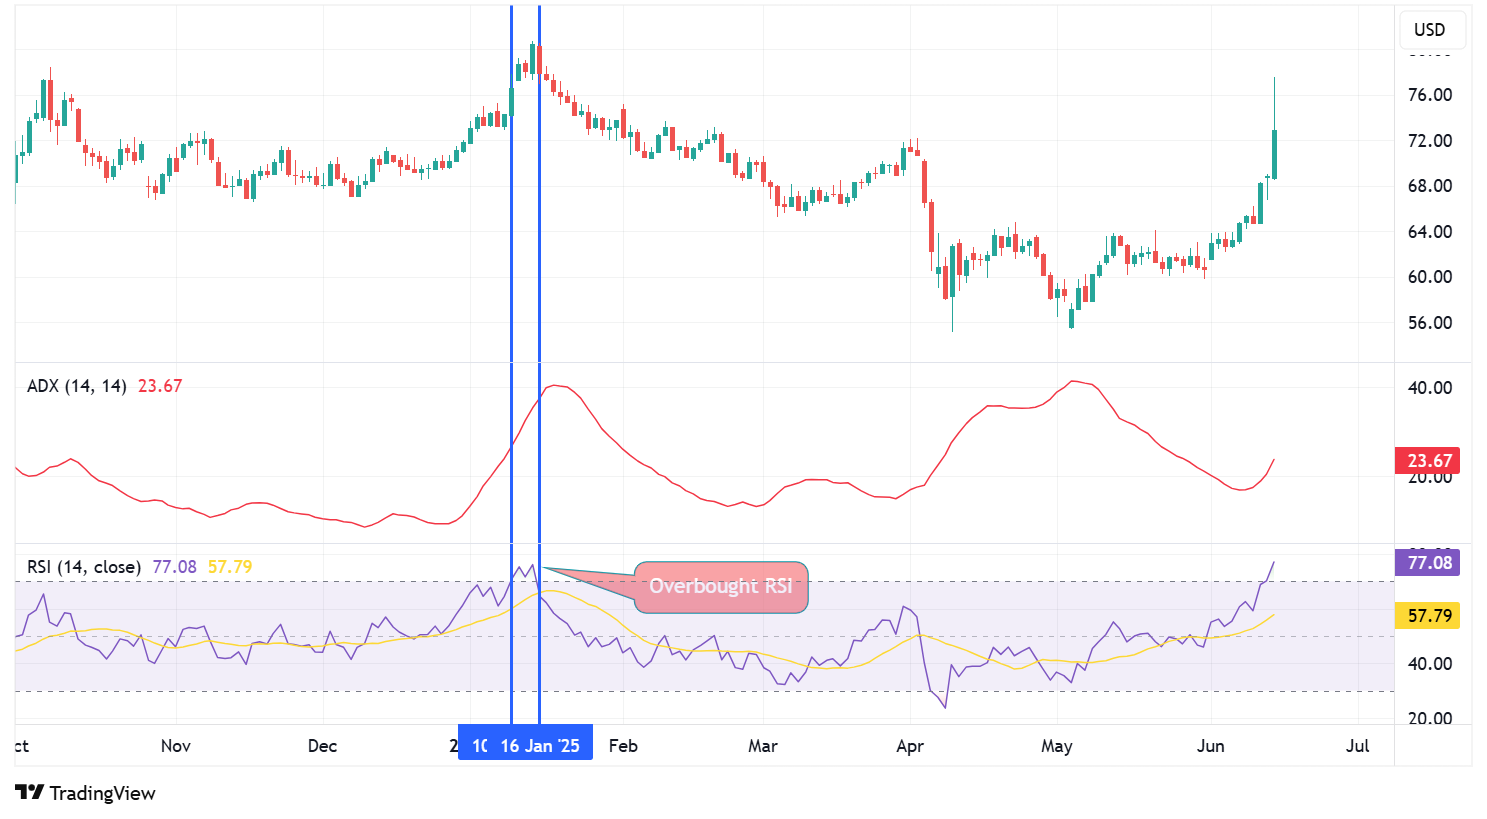
The RSI allows us to identify overbought and oversold conditions in the market. When used in combination with the ADX, the RSI can act as a confirmation tool or as a filter to avoid poor entries. For example:
This combination helps traders avoid entering too late in the move and improves timing and risk management.
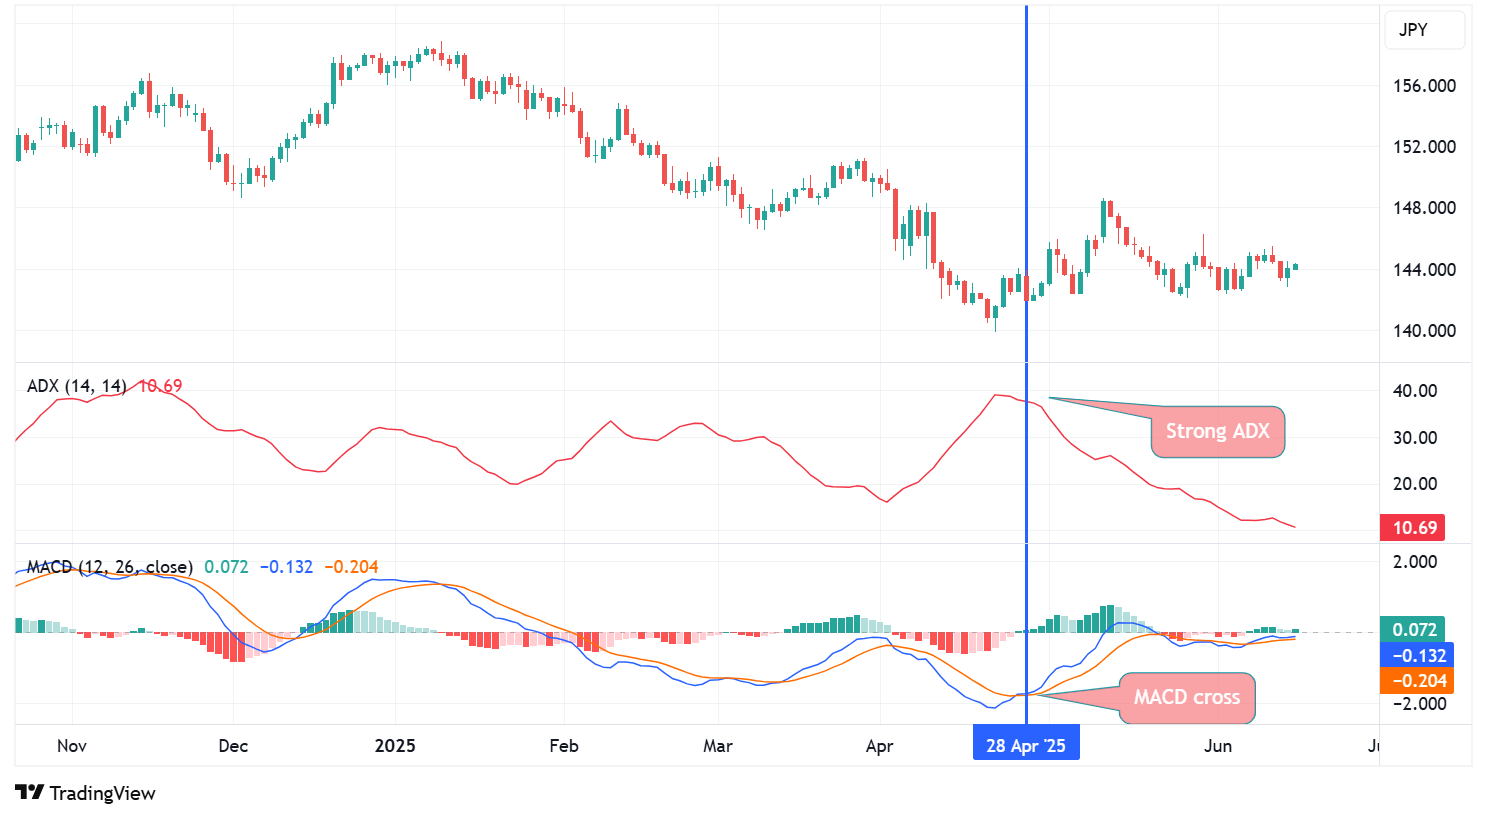
The MACD is a popular indicator that helps identify the direction of the trend and to detect shifts in momentum.
It works by comparing two moving averages (typically the 12- and 26-period EMAs), generating signals through crossovers, and analysing the MACD histogram.
When combined with the ADX:
This combination helps filter out false signals in sideways markets and improves confidence in trend-following entries.
The ADX indicator has several advantages, including:
However, the ADX also has disadvantages, such as:
The ADX is a popular technical indicator that allows traders to gauge the strength of a trend in the financial markets. The indicator consists of three lines: the ADX line, the +DI line, and the -DI line. The ADX fluctuates between 0 and 100, and a value of 25 or higher indicates a strong trend, regardless of its direction.
The +DI and -DI lines can show the trend's direction, and the crossover may signal a trade. However, the ADX is commonly used as a supporting tool, rather than to generate signals. It is often combined with other technical indicators such as the RSI, MACD and Moving Averages.
Ready to trade your edge?
Join thousands of traders and trade CFDs on forex, shares, indices, commodities, and cryptocurrencies!
This information is not to be construed as a recommendation; or an offer to buy or sell; or the solicitation of an offer to buy or sell any security, financial product, or instrument; or to participate in any trading strategy. It has been prepared without taking your objectives, financial situation and needs into account. Any references to past performance and forecasts are not reliable indicators of future results. Axi makes no representation and assumes no liability with regard to the accuracy and completeness of the content in this publication. Readers should seek their own advice.
FAQ
The ADX is a technical indicator that shows the strength of a trend of a financial instrument.
The ADX value tells us how strong a trend is, without indicating direction.
These readings help traders determine whether it's worth trading with the trend, or if the market is moving sideways and better avoided.
+DI measures an instrument’s upward movement, while -DI measures an instrument’s downward movement. Together they show us the direction of the trend.
It is a popular supporting tool, as it can tell traders if the current market environment is suitable for their trading strategy (i.e., if the market is trending or not).
The most commonly used setting for the ADX is 14 periods.
Yes, it can. Popular combinations include the RSI, MACD and Moving Averages.

